De interactieve procesviewer htop
Htop bewaakt interactief en real-time alle processen op Linux/Unix-achtige systemen. Het is dus een handig alternatief voor de top opdracht, wat een standaard procesbewakingstool is die standaard geïnstalleerd is op alle Linux-besturingssystemen.
Htop heeft talrijke gebruiksvriendelijke functies, die de opdracht top niet heeft en dat zijn:
- In htop kan je verticaal scrollen om de volledige proceslijst te bekijken en horizontaal scrollen om de volledige opdrachtregels te bekijken.
- Het start zeer snel in vergelijking met top omdat het niet wacht om gegevens op te halen tijdens het opstarten.
- In htop kan je meer dan één proces tegelijk geforceerd stoppen (kill) zonder hun PID's in te voeren.
- In htop hoef je niet langer het procesnummer of de prioriteitswaarde in te voeren om een proces opnieuw te starten.
- Druk op e om de omgevingsvariabelen voor een proces weer te geven.
- Gebruik de muis om lijst-items te selecteren.
Htop installeren
De htop pakketten zijn standaard beschikbaar in alle moderne Linux distributies en kunnen worden geïnstalleerd met de standaard pakketbeheerder van jouw systeem. In openSUSE Leap 15.4 gaat dit als volgt:
dany@pindabook:~> sudo zypper install htop
[sudo] wachtwoord voor root:
Ophalen van metagegevens uit opslagruimte 'Update repository of openSUSE Backports' ...........................................[gereed]
Cache van opslagruimte 'Update repository of openSUSE Backports' wordt gebouwd ................................................[gereed]
Ophalen van metagegevens uit opslagruimte 'Update repository with updates from SUSE Linux Enterprise 15' ......................[gereed]
Cache van opslagruimte 'Update repository with updates from SUSE Linux Enterprise 15' wordt gebouwd ...........................[gereed]
Gegevens van opslagruimte laden...
Lezen van geïnstalleerde pakketten...
Pakketafhankelijkheden oplossen...

De volgende 3 NIEUWE pakketten zullen worden geïnstalleerd:
  htop hwloc-data libhwloc15

3 nieuwe te installeren pakketten.
Totale downloadgrootte: 349,9 KiB. Reeds in de cache: 0 B. Na de bewerking zal aanvullend 698,2 KiB worden gebruikt.
Doorgaan? [j/n/v/...? alle opties tonen] (j):
pakket hwloc-data-2.5.0-150400.1.9.noarch wordt opgehaald                                        (1/3),  43,9 KiB ( 37,6 KiB uitgepakt)
Ophalen: hwloc-data-2.5.0-150400.1.9.noarch.rpm ...................................................................[gereed (1,2 KiB/s)]
pakket libhwloc15-2.5.0-150400.1.9.x86_64 wordt opgehaald                                        (2/3), 176,4 KiB (364,4 KiB uitgepakt)
Ophalen: libhwloc15-2.5.0-150400.1.9.x86_64.rpm ...................................................................[gereed (3,2 MiB/s)]
pakket htop-3.0.5-bp154.1.30.x86_64 wordt opgehaald                                              (3/3), 129,6 KiB (296,1 KiB uitgepakt)
Ophalen: htop-3.0.5-bp154.1.30.x86_64.rpm .....................................................................................[gereed]

Controleren op conflicten tussen bestanden: ...................................................................................[gereed]
(1/3) Installeren van: hwloc-data-2.5.0-150400.1.9.noarch .....................................................................[gereed]
(2/3) Installeren van: libhwloc15-2.5.0-150400.1.9.x86_64 .....................................................................[gereed]
(3/3) Installeren van: htop-3.0.5-bp154.1.30.x86_64 ...........................................................................[gereed]
Htop gebruiken
Voer nu de htop bewakingstool uit door de volgende opdracht in de terminal uit te voeren.
dany@pindabook:~> htop
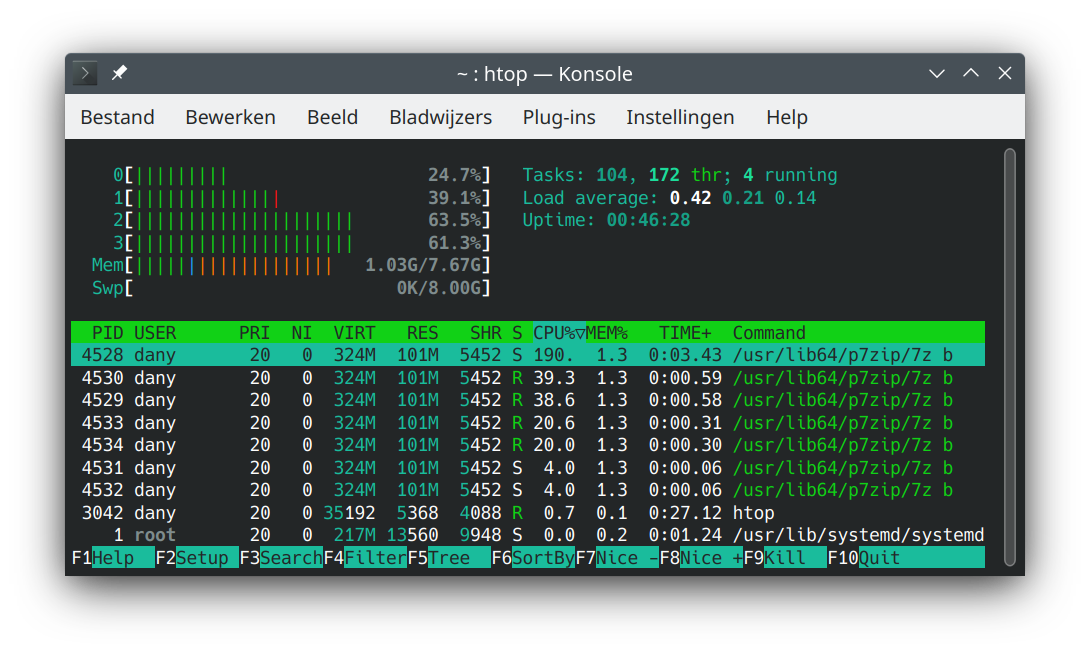
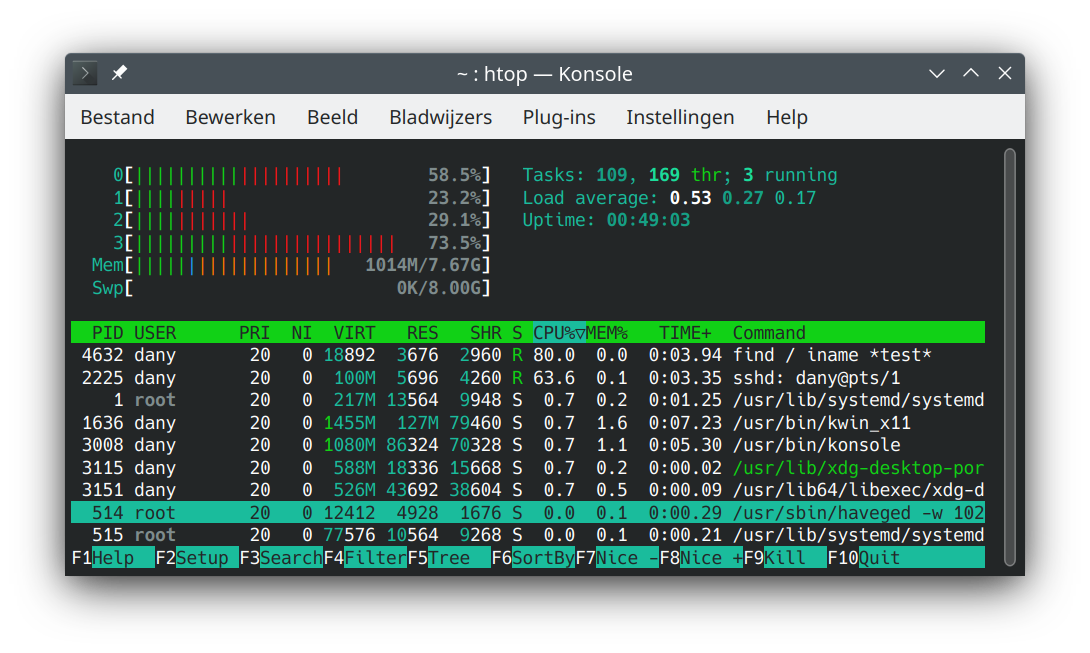
De drie panelen van htop
- Bovenaan krijgen we informatie over de CPU-belasting, Geheugen, Swap en ook lopende taken, gemiddelde belasting en bedrijfstijd (Uptime).
- Lijst van processen gesorteerd op CPU-gebruik.
- Onderaan worden verschillende opties getoond zoals Help, Setup, Filter, Tree, Kill, Nice, Quit, enz.
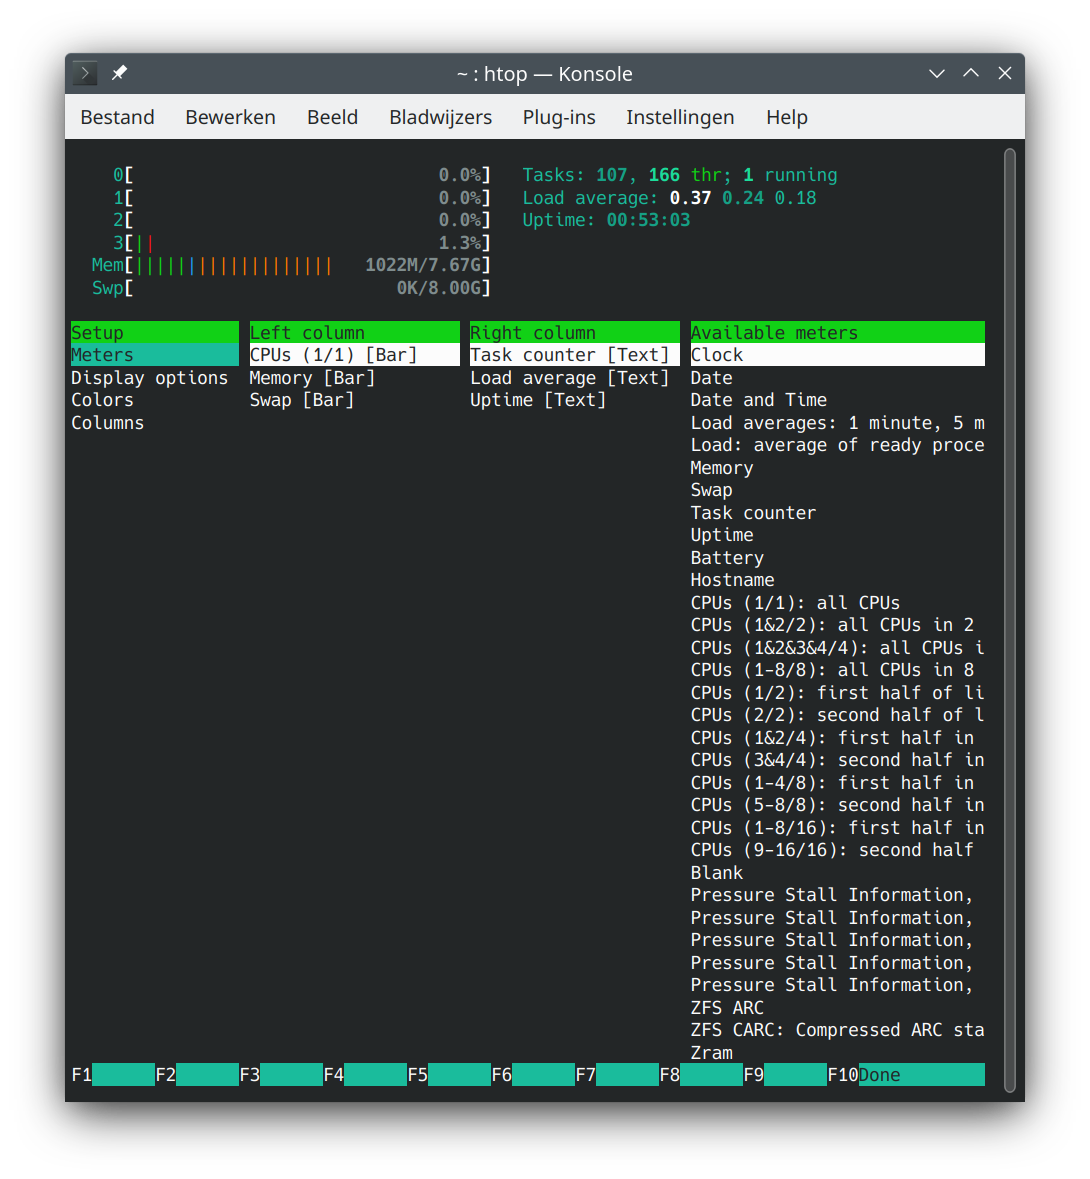
Druk op F2 of S voor het Setup-menu > er zijn vier kolommen: Setup, Left Column, Right Column en Available Meters.
Hier kan je de meters configureren die bovenaan het venster worden weergegeven, verschillende weergaveopties instellen, kleurpatronen kiezen en kiezen welke kolommen in welke volgorde worden weergegeven.
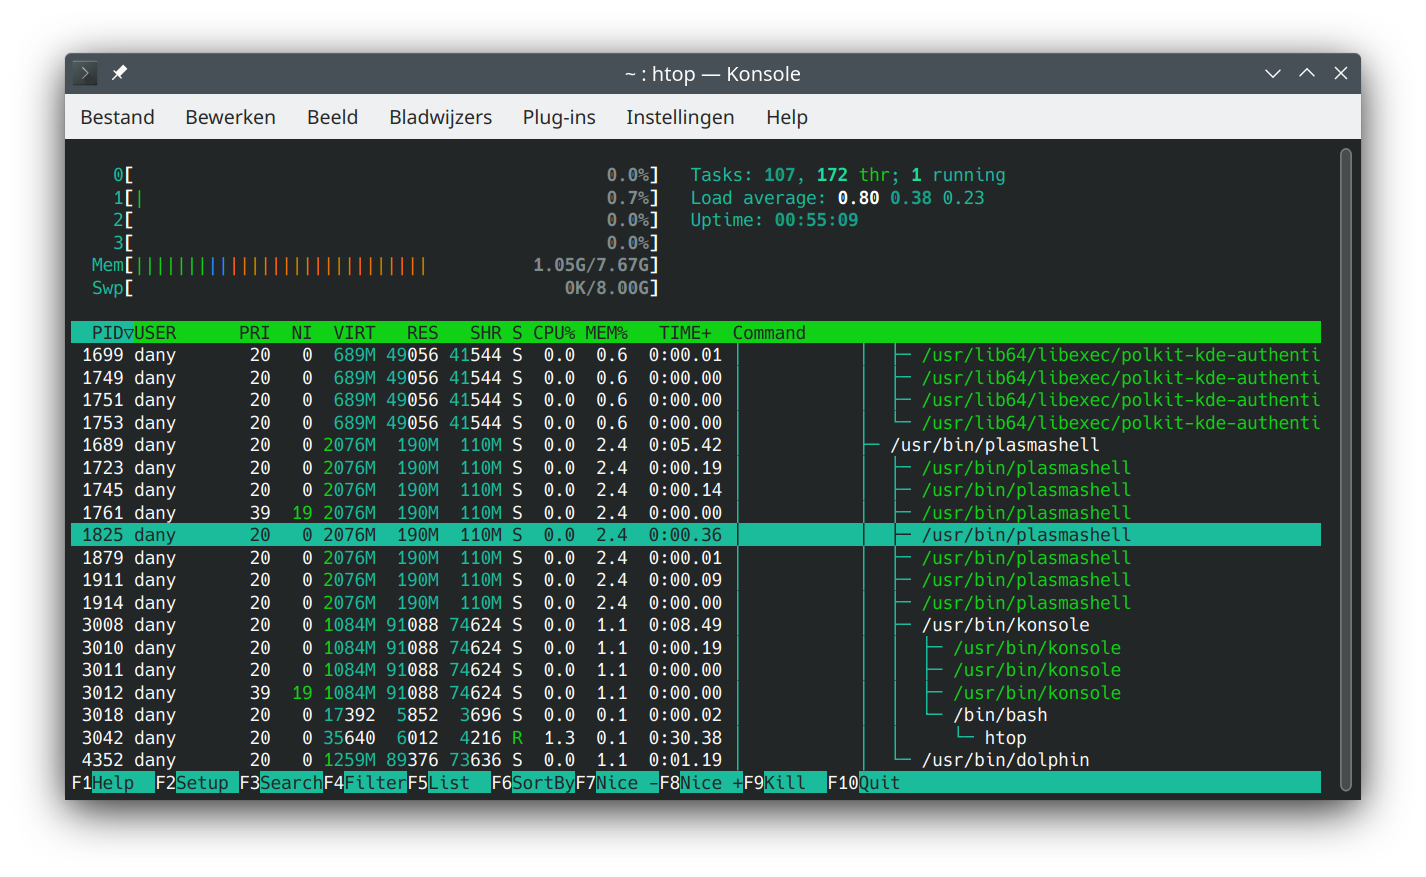
Typ tree of t om de boomstructuur van de processen weer te geven.
je kunt de functietoetsen in het onderste paneel gebruiken om htop te sturen bij het controleren van in Linux lopende processen. Je kunt echter ook sneltoetsen gebruiken in plaats van functietoetsen, deze zijn vooral handig bij het gebruik van beveiligde verbinding waarbij de functietoetsen reeds andere functies kregen.
Htop sneltoetsen en functietoetsen
In de man pagina (opdracht man htop) staan de sneltoetsen en functietoetsen vermeld in de sectie INTERACTIVE COMMANDS.
HTOP
NAMESYNOPSIS
DESCRIPTION
COMMAND-LINE OPTIONS
INTERACTIVE COMMANDS
COLUMNS
EXTERNAL LIBRARIES
CONFIG FILE
MEMORY SIZES
SEE ALSO
AUTHORS
NAME
htop − interactive process viewer
SYNOPSIS
htop [−dCFhpustvH]
DESCRIPTION
htop is a cross-platform ncurses-based process viewer.
It is similar to top, but allows you to scroll vertically and horizontally, and interact using a pointing device (mouse). You can observe all processes running on the system, along with their command line arguments, as well as view them in a tree format, select multiple processes and acting on them all at once.
Tasks related to processes (killing, renicing) can be done without entering their PIDs.
COMMAND-LINE OPTIONS
Mandatory
arguments to long options are mandatory for short options
too.
−d −−delay=DELAY
Delay between updates, in tenths of seconds. If the delay value is less than 1 it is increased to 1, i.e. 1/10 second. If the delay value is greater than 100, it is decreased to 100, i.e. 10 seconds.
−C −−no-color −−no-colour
Start htop in monochrome mode
−F −−filter=FILTER
Filter processes by command
−h −−help
Display a help message and exit
−p −−pid=PID,PID...
Show only the given PIDs
−s −−sort−key COLUMN
Sort by this column (use −−sort−key help for a column list). This will force a list view unless you specify -t at the same time.
−u −−user=USERNAME
Show only the processes of a given user
−U −−no-unicode
Do not use unicode but ASCII characters for graph meters
−M −−no-mouse
Disable support of mouse control
−V −−version
Output version information and exit
−t −−tree
Show processes in tree view. This can be used to force a tree view when requesting a sort order with -s.
−H −−highlight-changes=DELAY
Highlight new and old processes
INTERACTIVE COMMANDS
The following
commands are supported while in htop:
Up, Alt-k
Select (highlight) the previous process in the process list. Scroll the list if necessary.
Down, Alt-j
Select (highlight) the next process in the process list. Scroll the list if necessary.
Left, Alt-h
Scroll the process list left.
Right, Alt-l
Scroll the process list right.
PgUp, PgDn
Scroll the process list up or down one window.
|
Home |
Scroll to the top of the process list and select the first process. | ||
|
End |
Scroll to the bottom of the process list and select the last process. |
Ctrl-A, ^
Scroll left to the beginning of the process entry (i.e. beginning of line).
Ctrl-E, $
Scroll right to the end of the process entry (i.e. end of line).
Space
Tag or untag a process. Commands that can operate on multiple processes, like "kill", will then apply over the list of tagged processes, instead of the currently highlighted one.
|
c |
Tag the current process and its children. Commands that can operate on multiple processes, like "kill", will then apply over the list of tagged processes, instead of the currently highlighted one. | ||
|
U |
Untag all processes (remove all tags added with the Space or c keys). | ||
|
s |
Trace process system calls: if strace(1) is installed, pressing this key will attach it to the currently selected process, presenting a live update of system calls issued by the process. | ||
|
l |
Display open files for a process: if lsof(1) is installed, pressing this key will display the list of file descriptors opened by the process. | ||
|
w |
Display the command line of the selected process in a separate screen, wrapped onto multiple lines as needed. | ||
|
x |
Display the active file locks of the selected process in a separate screen. |
F1, h, ?
Go to the help screen
F2, S
Go to the setup screen, where you can configure the meters displayed at the top of the screen, set various display options, choose among color schemes, and select which columns are displayed, in which order.
F3, /
Incrementally search the command lines of all the displayed processes. The currently selected (highlighted) command will update as you type. While in search mode, pressing F3 will cycle through matching occurrences. Pressing Shift-F3 will cycle backwards.
Alternatively the search can be started by simply typing the command you are looking for, although for the first character normal key bindings take precedence.
F4, \
Incremental process filtering: type in part of a process command line and only processes whose names match will be shown. To cancel filtering, enter the Filter option again and press Esc.
F5, t
Tree view: organize processes by parenthood, and layout the relations between them as a tree. Toggling the key will switch between tree and your previously selected sort view. Selecting a sort view will exit tree view.
F6, <, >
Selects a field for sorting, also accessible through < and >. The current sort field is indicated by a highlight in the header.
F7, ]
Increase the selected process’s priority (subtract from ’nice’ value). This can only be done by the superuser.
F8, [
Decrease the selected process’s priority (add to ’nice’ value)
F9, k
"Kill" process: sends a signal which is selected in a menu, to one or a group of processes. If processes were tagged, sends the signal to all tagged processes. If none is tagged, sends to the currently selected process.
F10, q
Quit
|
I |
Invert the sort order: if sort order is increasing, switch to decreasing, and vice-versa. | ||
|
+, − |
When in tree view mode, expand or collapse subtree. When a subtree is collapsed a "+" sign shows to the left of the process name. |
a (on multiprocessor machines)
Set CPU affinity: mark which CPUs a process is allowed to use.
|
u |
Show only processes owned by a specified user. | ||
|
N |
Sort by PID. | ||
|
M |
Sort by memory usage (top compatibility key). | ||
|
P |
Sort by processor usage (top compatibility key). | ||
|
T |
Sort by time (top compatibility key). | ||
|
F |
"Follow" process: if the sort order causes the currently selected process to move in the list, make the selection bar follow it. This is useful for monitoring a process: this way, you can keep a process always visible on screen. When a movement key is used, "follow" loses effect. | ||
|
K |
Hide kernel threads: prevent the threads belonging the kernel to be displayed in the process list. (This is a toggle key.) | ||
|
H |
Hide user threads: on systems that represent them differently than ordinary processes (such as recent NPTL-based systems), this can hide threads from userspace processes in the process list. (This is a toggle key.) | ||
|
p |
Show full paths to running programs, where applicable. (This is a toggle key.) | ||
|
Z |
Pause/resume process updates. | ||
|
m |
Merge exe, comm and cmdline, where applicable. (This is a toggle key.) |
Ctrl-L
Refresh: redraw screen and recalculate values.
Numbers
PID search: type in process ID and the selection highlight will be moved to it.
COLUMNS
The following
columns can display data about each process. A value of
’−’ in all the rows indicates that a
column is unsupported on your system, or currently
unimplemented in htop. The names below are the ones
used in the "Available Columns" section of the
setup screen. If a different name is shown in
htop’s main screen, it is shown below in
parenthesis.
Command
The full command line of the process (i.e. program name and arguments). If the option ’Merge exe, comm and cmdline in Command’ (toggled by the ’m’ key) is set, and if readable, the executable path (/proc/[pid]/exe) and the command name (/proc/[pid]/comm) are also shown merged with the command line.
|
Comm |
The command name of the process obtained from /proc/[pid]/comm, if readable. | ||
|
Exe |
The abbreviated basename of the executable of the process, obtained from /proc/[pid]/exe, if readable. htop is able to read this file on linux for ALL the processes only if it has the capability CAP_SYS_PTRACE or root privileges. | ||
|
PID |
The process ID. |
STATE (S)
The state of the process:
S for sleeping (idle)
R for running
D for disk sleep (uninterruptible)
Z for zombie (waiting for parent to read its exit
status)
T for traced or suspended (e.g by SIGTSTP)
W for paging
|
PPID |
The parent process ID. |
|||
|
PGRP |
The process’s group ID. |
SESSION (SID)
The process’s session ID.
TTY_NR (TTY)
The controlling terminal of the process.
TPGID
The process ID of the foreground process group of the controlling terminal.
MINFLT
The number of page faults happening in the main memory.
CMINFLT
The number of minor faults for the process’s waited-for children (see MINFLT above).
MAJFLT
The number of page faults happening out of the main memory.
CMAJFLT
The number of major faults for the process’s waited-for children (see MAJFLT above).
UTIME (UTIME+)
The user CPU time, which is the amount of time the process has spent executing on the CPU in user mode (i.e. everything but system calls), measured in clock ticks.
STIME (STIME+)
The system CPU time, which is the amount of time the kernel has spent executing system calls on behalf of the process, measured in clock ticks.
CUTIME (CUTIME+)
The children’s user CPU time, which is the amount of time the process’s waited-for children have spent executing in user mode (see UTIME above).
CSTIME (CSTIME+)
The children’s system CPU time, which is the amount of time the kernel has spent executing system calls on behalf of all the process’s waited-for children (see STIME above).
PRIORITY (PRI)
The kernel’s internal priority for the process, usually just its nice value plus twenty. Different for real-time processes.
NICE (NI)
The nice value of a process, from 19 (low priority) to -20 (high priority). A high value means the process is being nice, letting others have a higher relative priority. The usual OS permission restrictions for adjusting priority apply.
STARTTIME (START)
The time the process was started.
PROCESSOR (CPU)
The ID of the CPU the process last executed on.
M_VIRT (VIRT)
The size of the virtual memory of the process.
M_RESIDENT (RES)
The resident set size (text + data + stack) of the process (i.e. the size of the process’s used physical memory).
M_SHARE (SHR)
The size of the process’s shared pages.
M_TRS (CODE)
The text resident set size of the process (i.e. the size of the process’s executable instructions).
M_DRS (DATA)
The data resident set size (data + stack) of the process (i.e. the size of anything except the process’s executable instructions).
M_LRS (LIB)
The library size of the process.
M_DT (DIRTY)
The size of the dirty pages of the process.
M_SWAP (SWAP)
The size of the process’s swapped pages.
M_PSS (PSS)
The proportional set size, same as M_RESIDENT but each page is divided by the number of processes sharing it.
M_M_PSSWP (PSSWP)
The proportional swap share of this mapping, unlike M_SWAP this does not take into account swapped out page of underlying shmem objects.
ST_UID (UID)
The user ID of the process owner.
PERCENT_CPU (CPU%)
The percentage of the CPU time that the process is currently using.
PERCENT_MEM (MEM%)
The percentage of memory the process is currently using (based on the process’s resident memory size, see M_RESIDENT above).
|
USER |
The username of the process owner, or the user ID if the name can’t be determined. |
TIME (TIME+)
The time, measured in clock ticks that the process has spent in user and system time (see UTIME, STIME above).
|
NLWP |
The number of threads in the process. |
|||
|
TGID |
The thread group ID. |
|||
|
CTID |
OpenVZ container ID, a.k.a virtual environment ID. |
|||
|
VPID |
OpenVZ process ID. |
|||
|
VXID |
VServer process ID. |
RCHAR (RD_CHAR)
The number of bytes the process has read.
WCHAR (WR_CHAR)
The number of bytes the process has written.
SYSCR (RD_SYSC)
The number of read(2) syscalls for the process.
SYSCW (WR_SYSC)
The number of write(2) syscalls for the process.
RBYTES (IO_RBYTES)
Bytes of read(2) I/O for the process.
WBYTES (IO_WBYTES)
Bytes of write(2) I/O for the process.
CNCLWB (IO_CANCEL)
Bytes of cancelled write(2) I/O.
IO_READ_RATE (DISK READ)
The I/O rate of read(2) in bytes per second, for the process.
IO_WRITE_RATE (DISK WRITE)
The I/O rate of write(2) in bytes per second, for the process.
IO_RATE (DISK R/W)
The I/O rate, IO_READ_RATE + IO_WRITE_RATE (see above).
CGROUP
Which cgroup the process is in.
|
OOM |
OOM killer score. | ||
|
CTXT |
Incremental sum of voluntary and nonvoluntary context switches. |
IO_PRIORITY (IO)
The I/O scheduling class
followed by the priority if the class supports it:
R for Realtime
B for Best-effort
id for Idle
PERCENT_CPU_DELAY (CPUD%)
The percentage of time spent waiting for a CPU (while runnable). Requires CAP_NET_ADMIN.
PERCENT_IO_DELAY (IOD%)
The percentage of time spent waiting for the completion of synchronous block I/O. Requires CAP_NET_ADMIN.
PERCENT_SWAP_DELAY (SWAPD%)
The percentage of time spent swapping in pages. Requires CAP_NET_ADMIN.
|
COMM |
The command name for the process. Requires Linux kernel 2.6.33 or newer. | ||
|
EXE |
The executable file of the process as reported by the kernel. Requires CAP_SYS_PTRACE and PTRACE_MODE_READ_FSCRED. |
All other flags
Currently unsupported (always displays ’-’).
EXTERNAL LIBRARIES
While
htop depends on most of the libraries it uses at
build time there are two noteworthy exceptions to this rule.
These exceptions both relate to data displayed in meters
displayed in the header of htop and were
intentionally created as optional runtime dependencies
instead. These exceptions are described below:
libsystemd
The bindings for libsystemd are used in the SystemD meter to determine the number of active services and the overall system state. Looking for the functions to determine these information at runtime allows for builds to support these meters without forcing the package manager to install these libraries on systems that otherwise don’t use systemd.
Summary: no build time dependency, optional runtime dependency on libsystemd via dynamic loading, with systemctl(1) fallback.
libsensors
The bindings for libsensors are used for the CPU temperature readings in the CPU usage meters if displaying the temperature is enabled through the setup screen. In order for htop to show these temperatures correctly though, a proper configuration of libsensors through its usual configuration files is assumed and that all CPU cores correspond to temperature sensors from the coretemp driver with core 0 corresponding to a sensor labelled "Core 0". The package temperature may be given as "Package id 0". If missing it is inferred as the maximum value from the available per-core readings.
Summary: build time dependency on libsensors(3) C header files, optional runtime dependency on libsensors(3) via dynamic loading.
CONFIG FILE
By default htop reads its configuration from the XDG-compliant path ~/.config/htop/htoprc. The configuration file is overwritten by htop’s in-program Setup configuration, so it should not be hand-edited. If no user configuration exists htop tries to read the system-wide configuration from /etc/htoprc and as a last resort, falls back to its hard coded defaults.
You may override the location of the configuration file using the $HTOPRC environment variable (so you can have multiple configurations for different machines that share the same home directory, for example).
MEMORY SIZES
Memory sizes in htop are displayed in a human-readable form. Sizes are printed in powers of 1024. (e.g., 1023M = 1072693248 Bytes)
The decision to use this convention was made in order to conserve screen space and make memory size representations consistent throughout htop.
SEE ALSO
proc(5), top(1), free(1), ps(1), uptime(1) and limits.conf(5).
AUTHORS
htop was originally developed by Hisham Muhammad. Nowadays it is maintained by the community at <htop@groups.io>.
Htop volledig van de computer verwijderen
Verwijder de htop opdracht en alle bijhorende en niet langer noodzakelijke afhankelijke pakketten met:
dany@pindabook:~> sudo zypper remove -u htop
[sudo] wachtwoord voor root:
Lezen van geïnstalleerde pakketten...
Pakketafhankelijkheden oplossen...

De volgende 3 pakketten zullen worden VERWIJDERD:
  htop hwloc-data libhwloc15

3 te verwijderen pakketten.
Na de bewerking zal 698,2 KiB worden vrijgemaakt.
Doorgaan? [j/n/v/...? alle opties tonen] (j):
(1/3) Verwijderen van htop-3.0.5-bp154.1.30.x86_64 ............................................................................[gereed]
(2/3) Verwijderen van libhwloc15-2.5.0-150400.1.9.x86_64 ......................................................................[gereed]
(3/3) Verwijderen van hwloc-data-2.5.0-150400.1.9.noarch ......................................................................[gereed]